
The Participation report shows members who have participation in the community, their type of Participation, and the number of times they have performed each type during the period defined.
Data Points
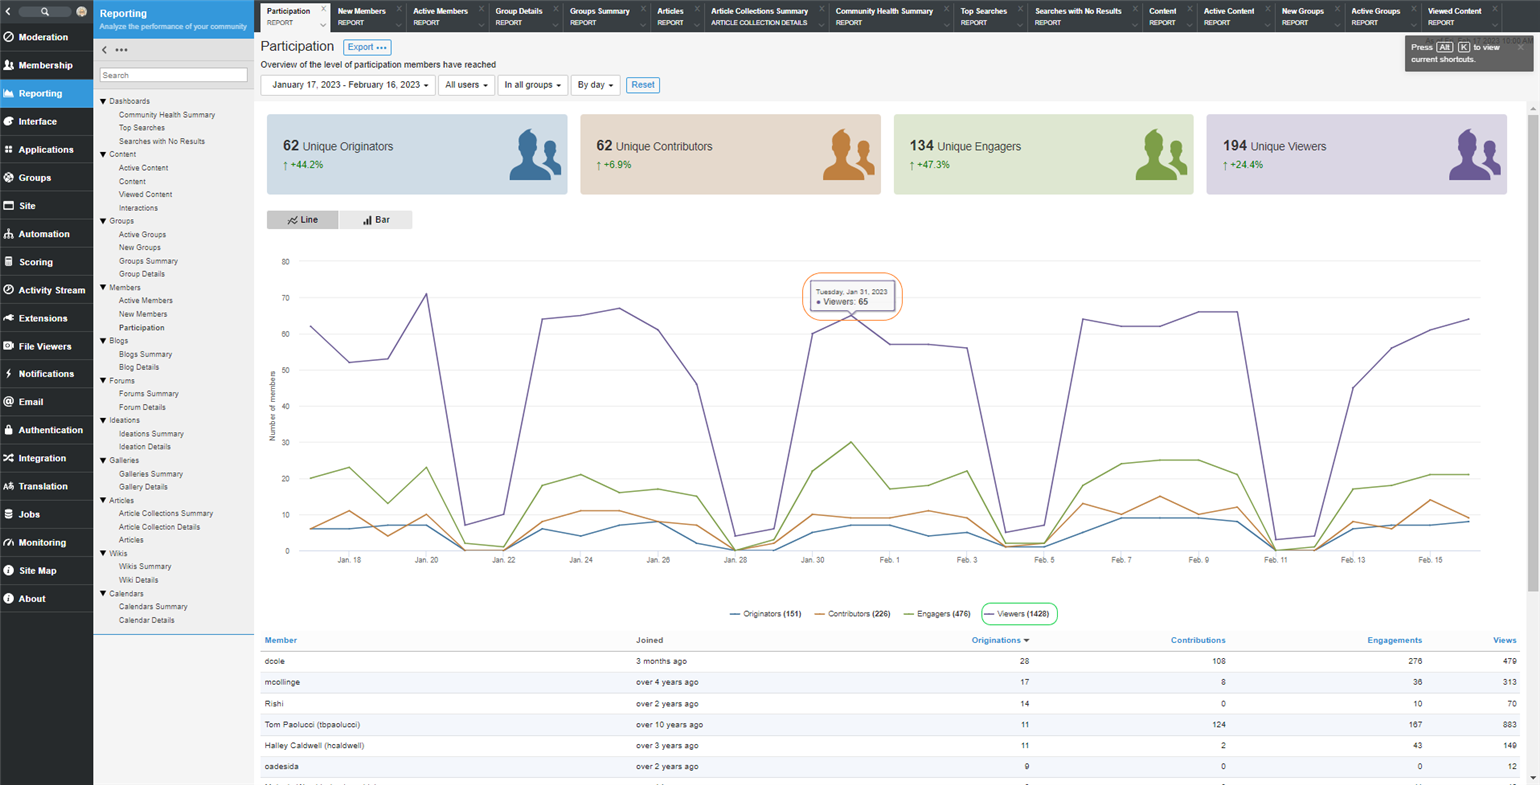
| Data Point | Location | Description |
| Totals | Top Cards |
The total number of unique members who participated as Originators, Contributors, Engagers and Viewers between the specified start and end dates. |
| Trend | Top Cards |
The percent of change from the previous period specified for each type of Participation. |
| Data Point Total | Orange Circle |
Each clickable data point shows the total number of members for each type of Participation during that data point interval (day, week, month or year). Additionally, each type of Participation can be shown or hidden by clicking on the corresponding item in the graph's key. |
| Data Point Aggregate | Green Circle |
The totals at the bottom are an aggregate for each of the reported data point intervals (day, week, month or year). NOTE: These will not be unique as the same Participation for a member could be reported on multiple data points. |
| Participant List | Page Bottom |
The list displays members that have participated during the date range and the quantity of each type of Participation they performed. |
Usage
Filters: Date Range, Users, Roles
Report Access: Any user with the View Site Reports or View Group Reports permission can view this report. Users with View Group Reports permission are limited to viewing Groups or Applications where they have the permission.
Exports:
- A PNG image of the Participation graph
- A CSV file of the data used to create the Participation graph
- A CSV file of the list of active members. The CSV contains the following fields:
- User Id
- Username
- Profile URL
- Email Address
- Join Date
- Number of Originations
- Number of Contributions
- Number of Engagements
- Number of Views