
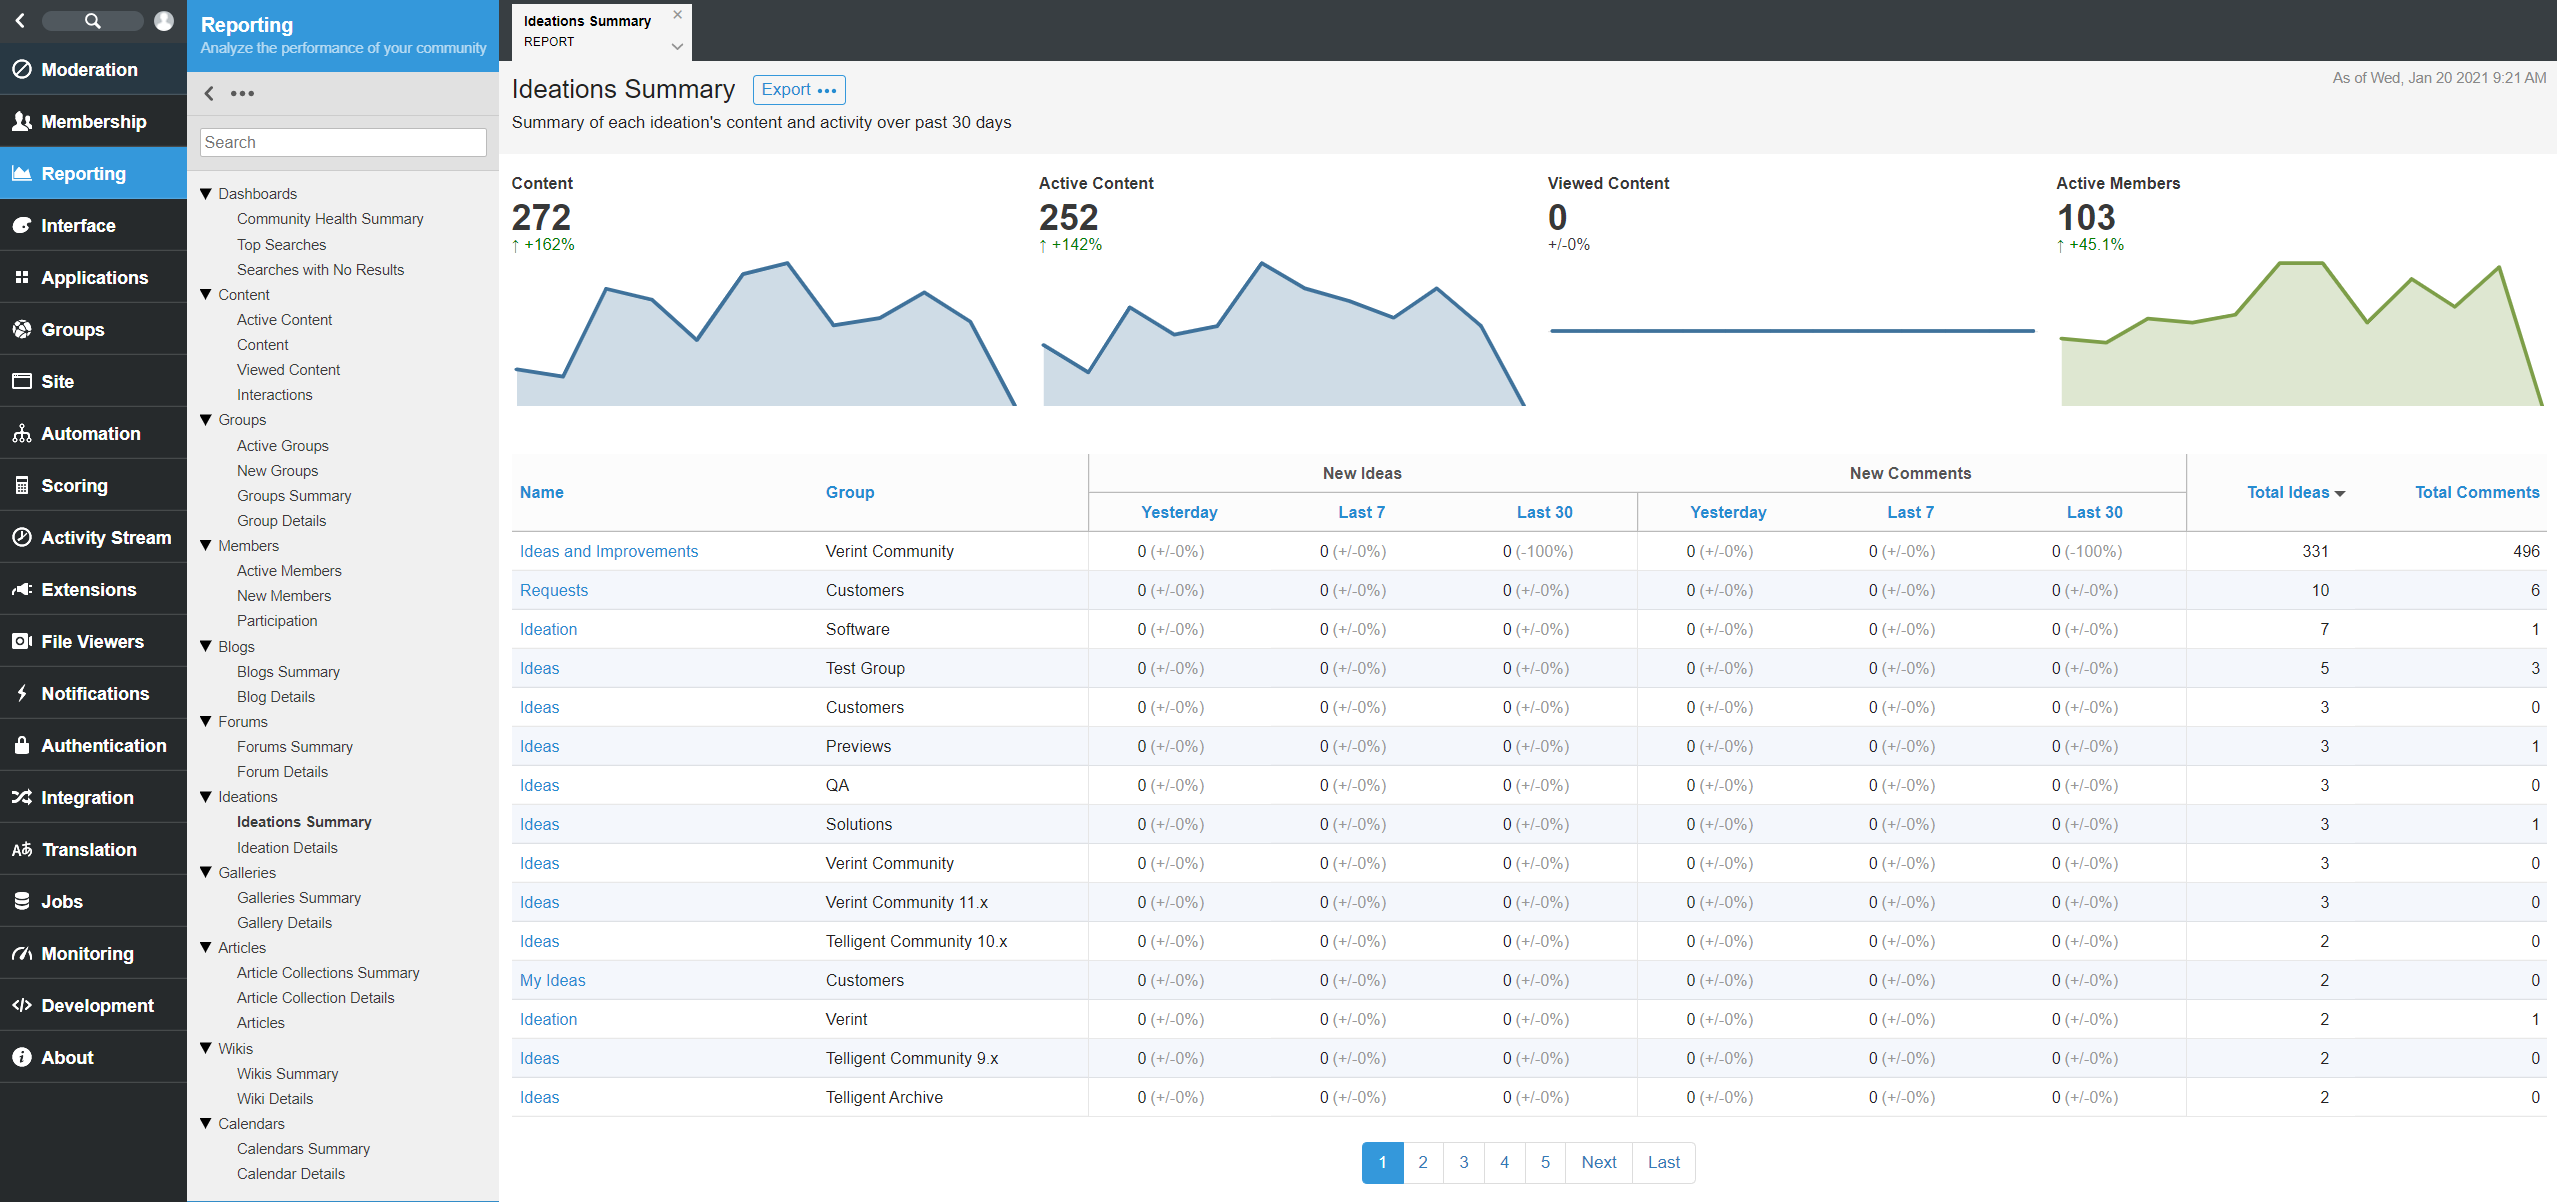
The Ideations Summary report is a paged list of all ideations within the community.
Charts
At the top of the report are charts which show an aggregate of values over the last 30 days. These numbers do not include the current day.
| Name | Description |
| Content | The content created over the last 30 days. Clicking this chart will take you to the Content report filtered to ideations. |
| Active Content |
The content with at least one active activity over the last 30 days. Clicking this chart will take you to the Active Content report filtered to ideations. |
| Viewed Content |
The content with at least one view over the last 30 days. Clicking this chart will take you to the Viewed Content report filtered to ideations. |
| Active |
The count of members with at least one activity in ideations over the last 30 days. Clicking this chart will take you to the Active Members report filtered to ideations. |
Data Points
| Data Point | Description |
| Yesterday | The day before the last run of the Reporting ETL job along with the percentage of change from the previous day. |
| Last 7 | The last 7 days, up to and including yesterday, along with the percentage of change from the previous 7 day period. |
| Last 30 | The last 30 days, up to and including yesterday, along with the percentage of change from the previous 30 day period. |
Usage
Filters: None
Report Access: Any user with the View Site Reports permission can view this report.
Exports:
- A CSV file of the list of Groups. The CSV contains the following fields:
- Id
- Title
- Url
- New Idea Count Last (1 Day, 3 Days, 7 Days, 30 Days, 90 Days 180 Days)
- New Comment Count Last (1 Day, 3 Days, 7 Days, 30 Days, 90 Days 180 Days)
- Total Ideas
- Total Comments
- Group Id
- Group Name