
Report Overview
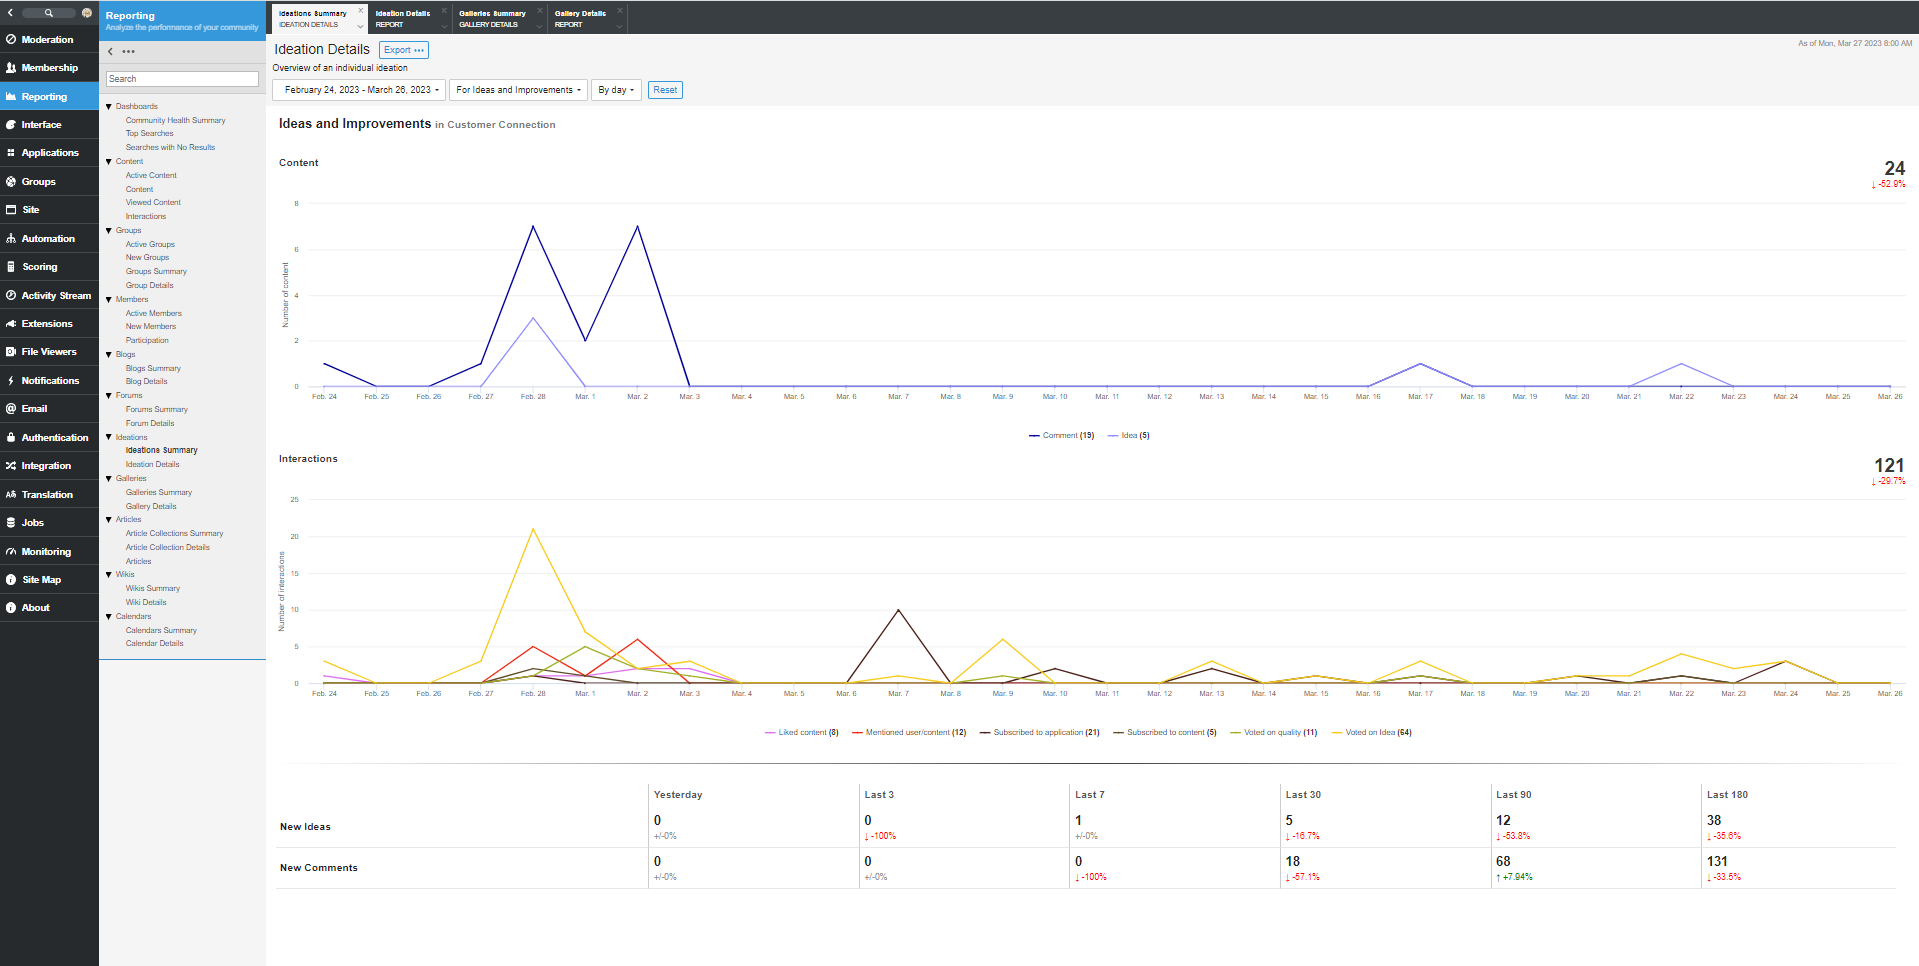
The Ideation Details report shows an overview of the selected ideation.
Report Breakdown
Content
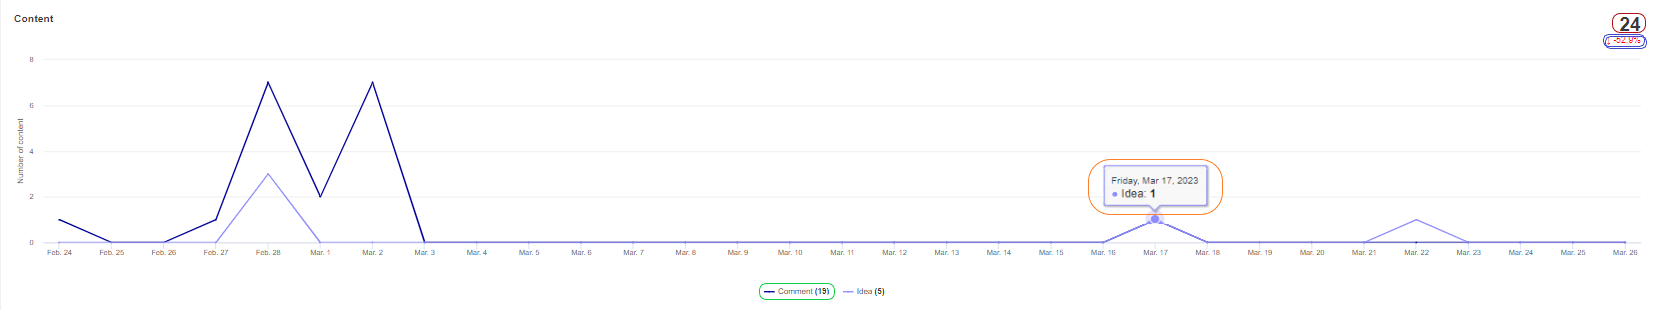
| Data Point | Location | Description |
| Total | Red Circle |
The total number of ideas submitted during the dates between the specified start and end dates. |
| Trend | Blue Circle |
The percent of changes from the previous time period specified. |
| Data Point Total | Orange Circle |
Each clickable data point shows the total number of ideas submitted during that data point interval (day, week, month or year). |
| Data Point Aggregate |
Green Circle |
The total for each Data Point displayed in the graph. |
Interactions
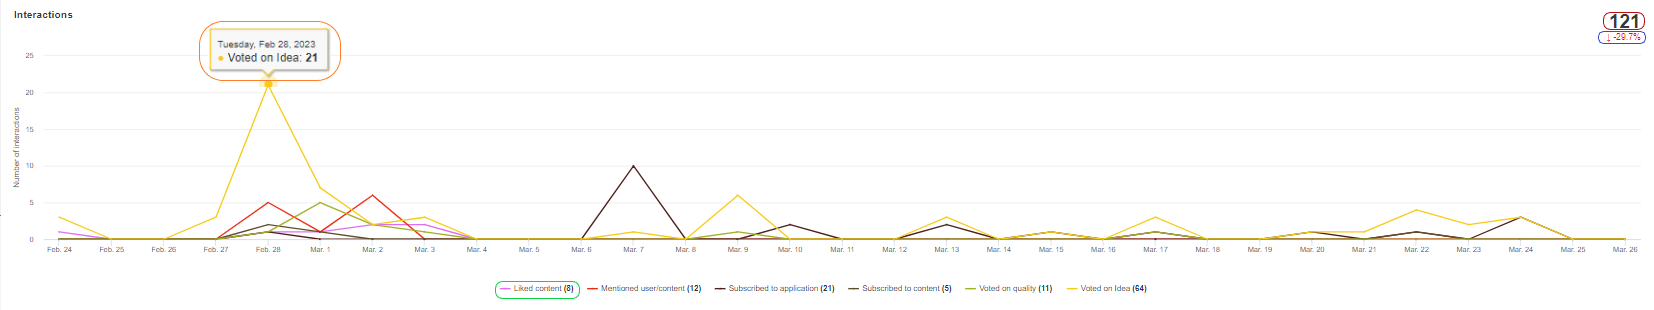
Precalculated List
Filters: Date Range, Single Application
Report Access: Any user with the View Site Reports or View Group Reports permission can view this report. Users with View Group Reports permission are limited to viewing Groups where they have the permission.
Exports:
- A CSV file of the group summary. The CSV contains the following fields:
- Id
- Title
- Url
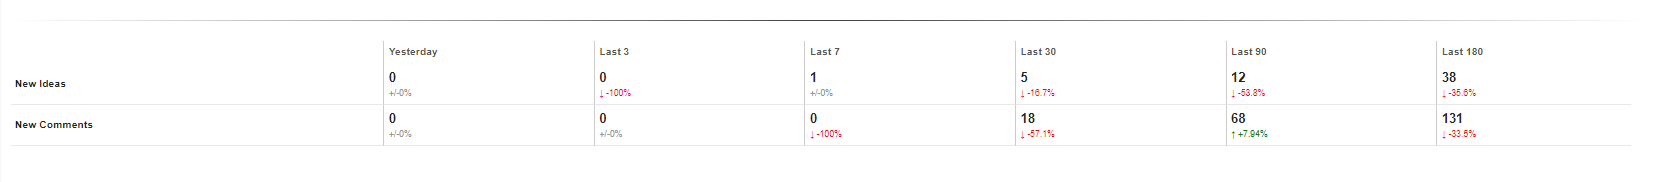
- New Idea Count Last (1 Day, 3 Days, 7 Days, 30 Days, 90 Days, 180 Days)
- New Comment Count Last (1 Day, 3 Days, 7 Days, 30 Days, 90 Days, 180 Days)
- Total Ideas
- Total Comments
- Group Id
- Group Name