
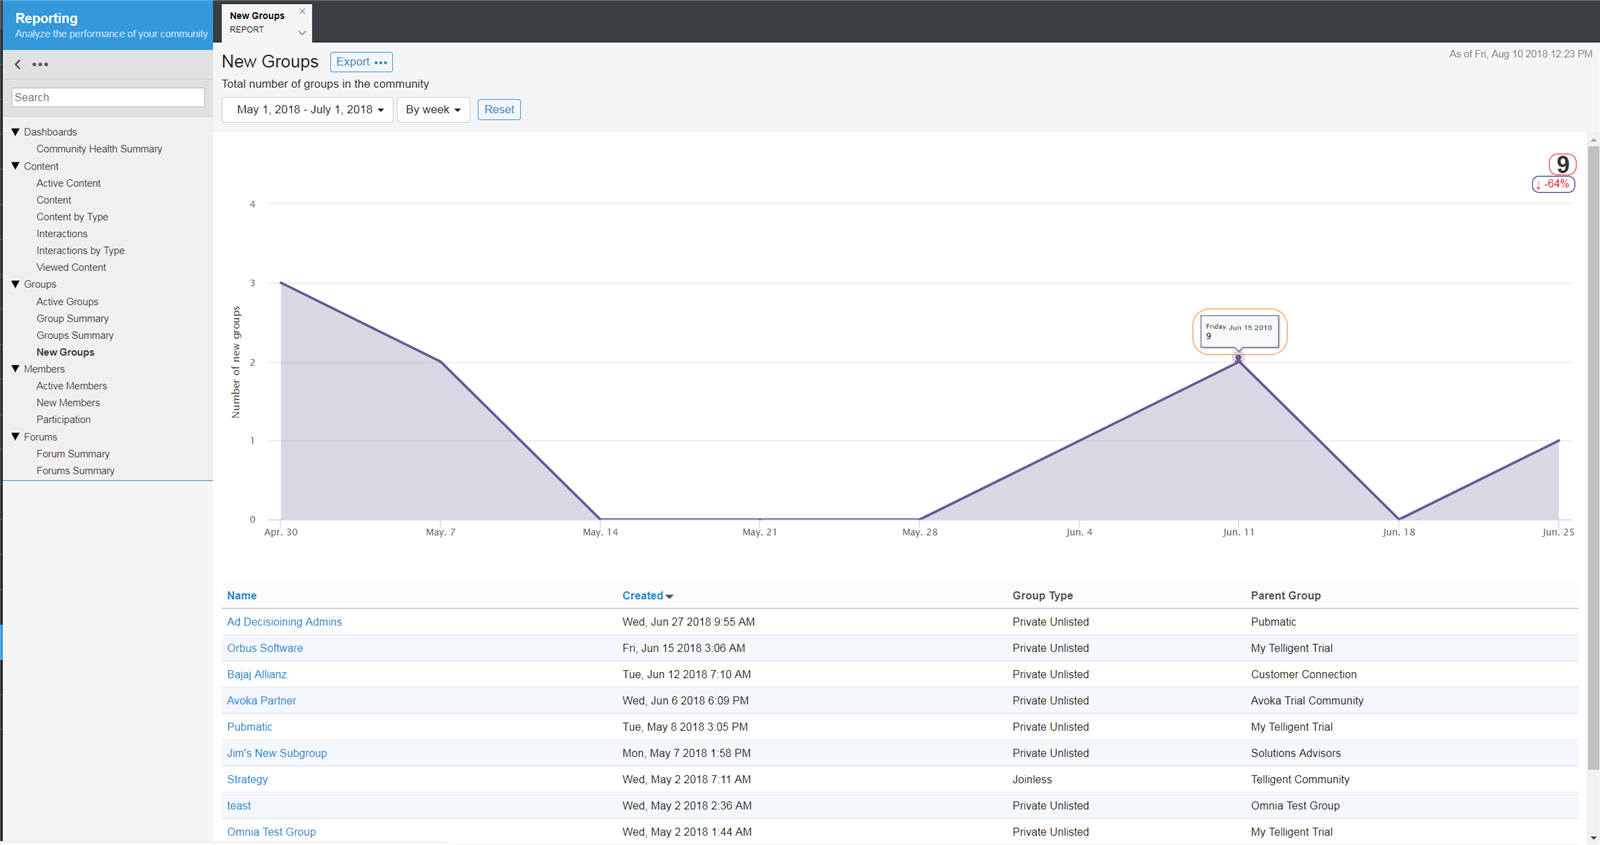
The New Groups report shows when groups are created. This can be used to understand the volume of groups being created.
Data Points
| Data Point | Location | Description |
| Total |
Red Circle |
The total number of groups created during the dates between the specified start and end dates. |
| Trend | Blue Circle |
The percent of changes from the previous period specified. |
| Data Point Total | Orange Circle |
Each clickable data point shows the total number of groups created during that data point interval (day, week, month or year). |
Usage
Filters: Date Range
Report Access: Any user with the View Site Reports permission can view this report.
Exports:
- A PNG image of the New Groups graph
- A CSV file of the data used to create the New Groups graph
- A CSV file of the list of content. The CSV contains the following fields:
- Id
- Name
- Url
- Parent Group
- Date Created
- Group Type
- Total Members