
Report Overview
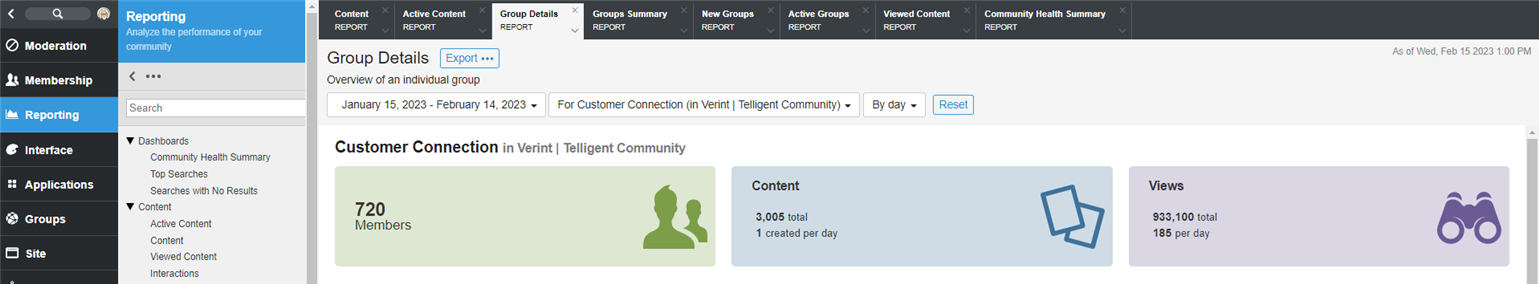
The Group Details report provides a quick view into the key performance indicators (members, content and interactions) for the selected group to understand the size, growth, level of activity, and amount of engagement.
Typically, this information is available to the Community Manager who is responsible for reporting on how well the community is functioning and recommendations for improvements.
Report Breakdown
Cards
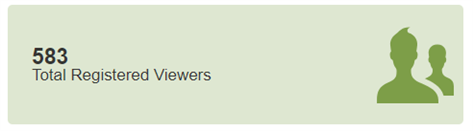
NOTE: Joinless Groups, which don't have members, will display the following.
| Data Point | Description |
|
Members |
The total number of members within this group. |
| Content |
The total amount of content since the group was created, along with the average amount of content created per day. |
| Views |
The total views that occurred since the group was created, along with the average amount of views per day. |
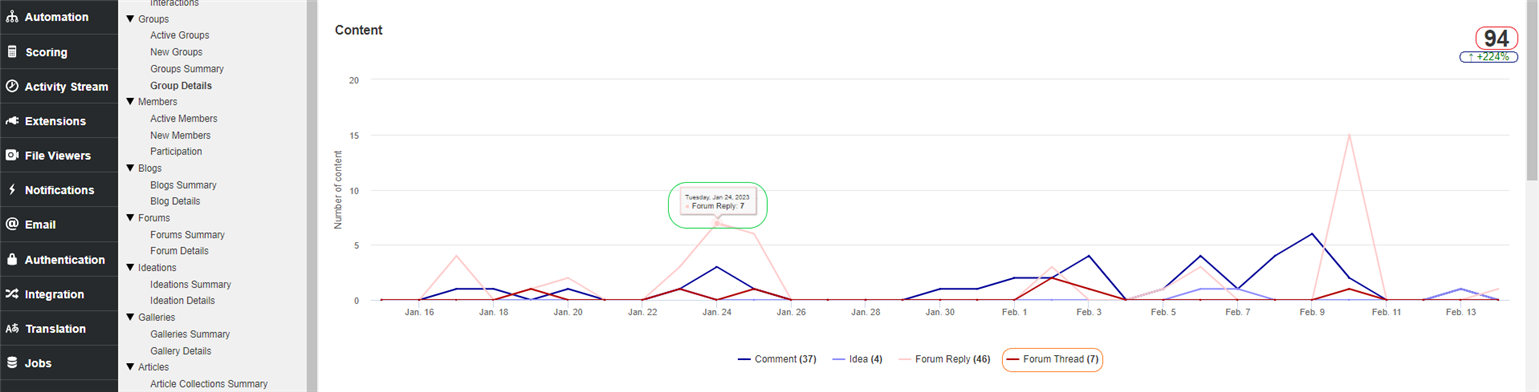
Content
| Data Point | Location | Description |
| Total | Red Circle | The total number of approved content created during the dates between the specified start and end dates. Unapproved or abusive content is not included. |
| Trend | Blue Circle |
The percent of changes from the previous time period specified. |
| Data Point Total | Orange Circle |
Each clickable data point shows the total number of unique content created during that data point interval (day, week, month or year). Unapproved or abusive content is not included. Additionally each type of Interaction can be shown or hidden by clicking on the corresponding item in the graph's key. |
| Data Point Aggregate |
Green Circle |
The total for each Data Point displayed in the graph. |
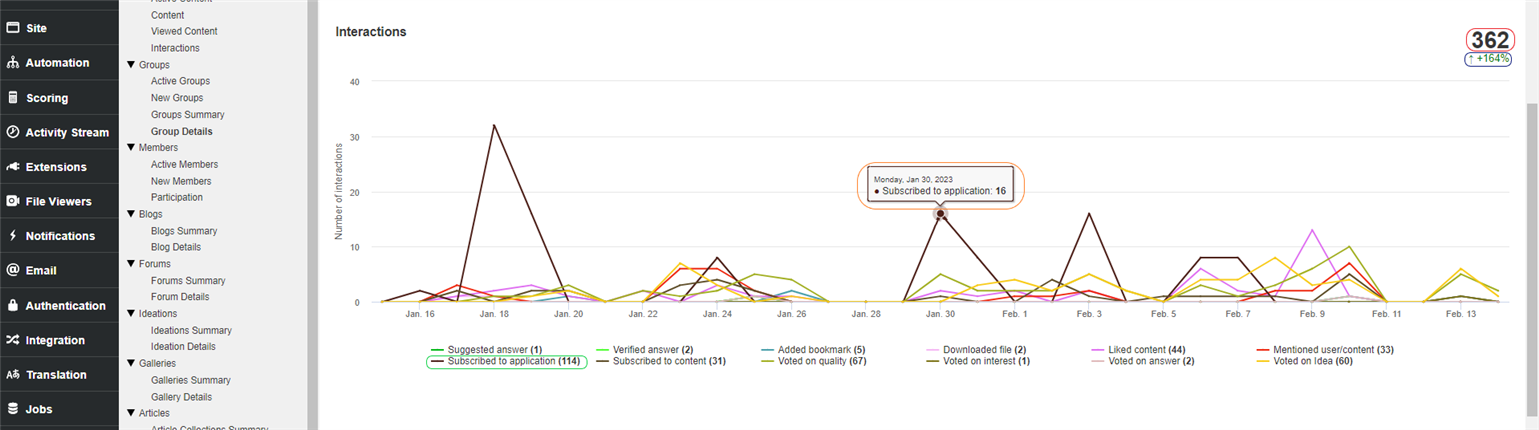
Interactions
| Data Point | Location | Description |
| Total | Red Circle | The total number of interactions during the dates between the specified start and end dates. |
| Trend | Blue Circle |
The percent of changes from the previous time period specified. |
| Data Point Total | Orange Circle |
Clickable data point shows the total number of unique interactions during that data point interval (day, week, month or year). |
| Data Point Aggregate |
Green Circle |
The total for each Data Point displayed in the graph. |
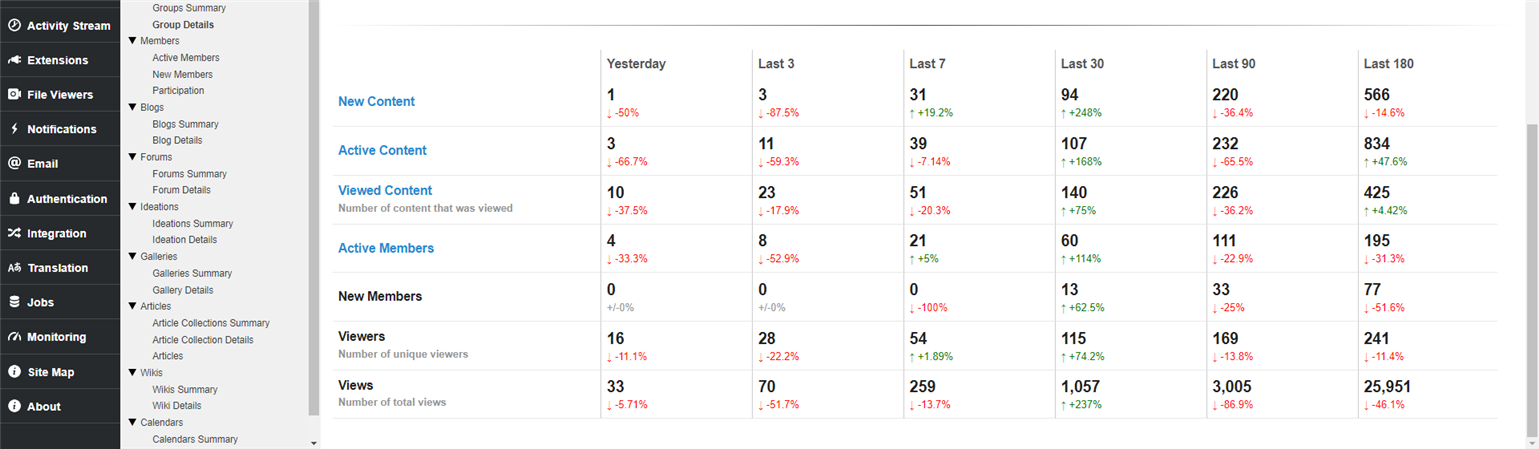
Precalculated List
Usage
Filters: Date Range, Single Group
Report Access: Any user with the View Site Reports or View Group Reports permission can view this report. Users with View Group Reports permission are limited to viewing Groups where they have the permission.
Exports:
- A CSV file of the group summary. The CSV contains the following fields:
- Id
- Name
- Url
- Parent Group
- Members Total
- Owners (Group Role)
- Managers (Group Role)
- Members (Group Role)
- Last Activity
- Date Created
- Created By User
- Created By User Id
- New Member Count Last (1 Day, 3 Days, 7 Days, 30 Days, 90 Days, 180 Days)
- Active Content Count Last (1 Day, 3 Days, 7 Days, 30 Days, 90 Days, 180 Days)
- Engaged Content Count Last (1 Day, 3 Days, 7 Days, 30 Days, 90 Days, 180 Days)
- Contributed Content Count Last (1 Day, 3 Days, 7 Days, 30 Days, 90 Days, 180 Days)
- Originated Content Count Last (1 Day, 3 Days, 7 Days, 30 Days, 90 Days, 180 Days)
- Viewed Content Count Last (1 Day, 3 Days, 7 Days, 30 Days, 90 Days, 180 Days)
- Active Activity Count Last (1 Day, 3 Days, 7 Days, 30 Days, 90 Days, 180 Days)
- Engagement Activity Count Last (1 Day, 3 Days, 7 Days, 30 Days, 90 Days, 180 Days)
- Contribution Activity Count Last (1 Day, 3 Days, 7 Days, 30 Days, 90 Days, 180 Days)
- Origination Activity Count Last (1 Day, 3 Days, 7 Days, 30 Days, 90 Days, 180 Days)
- View Count Last (1 Day, 3 Days, 7 Days, 30 Days, 90 Days, 180 Days)