
The New Groups report shows the groups created during the specified Period. This can be used to understand the volume of groups being created.
Data Points
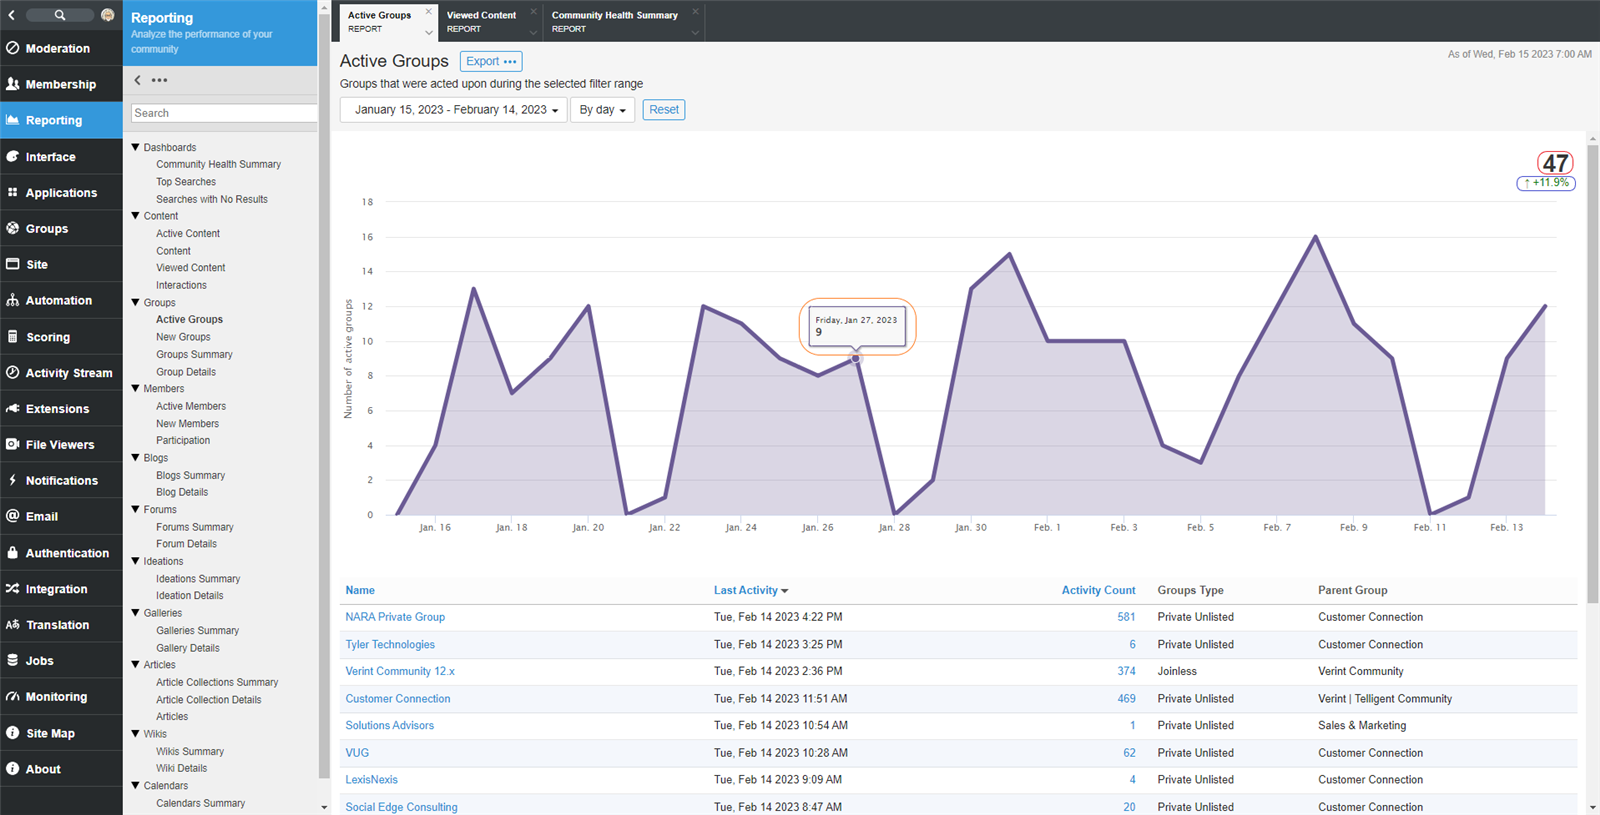
| Data Point | Location | Description |
| Total |
Red Circle |
The total number of groups with active activities that occurred during the dates between the specified start and end dates. |
| Trend | Blue Circle |
The percent of changes from the previous period specified. |
| Data Point Total |
Orange Circle |
Each clickable data point shows the total number of groups with active activities during that data point interval (day, week, month or year). Additionally each type of Interaction can be shown or hidden by clicking on the corresponding item in the graph's key. |
| Activity List |
Page Bottom |
The list displays the number of activities that occurred within each group during the dates specified. The Group's Type, Parent Group, and date of last activity are also identified. |
Usage
Filters: Date Range
Report Access: Any user with the View Site Reports permission can view this report.
Exports:
- A PNG image of the New Groups graph
- A CSV file of the data used to create the New Groups graph
- A CSV file of the list of content. The CSV contains the following fields:
- Id
- Name
- Url
- Parent Group
- Last Activity Date
- Total Activity Count
- Group Type
- Total Members