
The Forum Details report shows an overview of the selected forum.
Fig.1: Cards
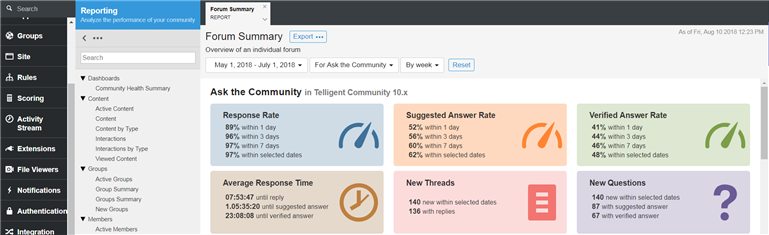
Cards Data Points
| Data Point | Description |
| Response Rate | The 1 day, 3 day 7 day and overall rate at which threads created during the specified start and end dates have a response by a user other than the thread author. |
| Suggested Answer Rate | The 1 day, 3 day 7 day and overall rate at which threads created during the specified start and end dates have a suggested answer response. |
| Verified Answer Rate | The 1 day, 3 day 7 day and overall rate at which threads created during the specified start and end dates have a Verified answer response. |
| Average Response Time | The average time for threads created during the specified start and end dates have either a response by a user other than the thread author (until reply) or a reply marked as a suggested answer (until suggested answer) or a reply marked as a verified answer (until verified answer). |
| New Threads | The total thread count or count of threads with replies that were created between the specified start and end dates. |
| New Questions | The total question thread count or count of question threads with suggested answers or verified answers that were created between the specified start and end dates. |
Fig.2: Content by Type Line Graph
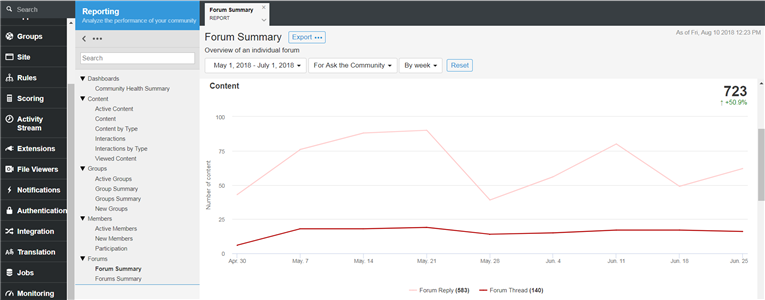
Content Data Points
| Data Point | Total Reported Above | Description |
| Total | 723 | The total number of unique content with at least one active action during the dates between the specified start and end dates. |
| Trend | +50.9% |
The percent of change from the previous time period specified. |
| Content | 583 / 140 |
The graph of content Forum Replies and Forum Threads created by type is available in line format. Each clickable data point on the line graph shows the total number of content by type created during that data point interval (day, week, month or year). Additionally each type of content can be shown or hidden by clicking on the corresponding item in the graph's key. |
Fig.3: Interactions Line Graph
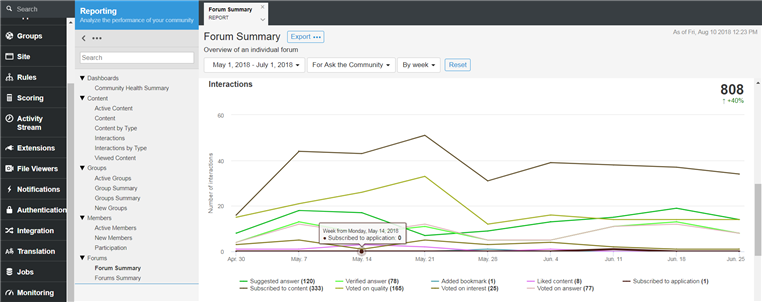
Interactions Data Points
| Data Point | Total Reported Above | Description |
| Total | 808 | The total number of unique content with at least one active action during the dates between the specified start and end dates. |
| Trend | +40% | The percent of changes from the previous time period specified. |
| Data Point Total |
• Subscribed to application: 0 |
Each clickable data point shows the total number of unique content with at least one active action during that data point interval (day, week, month or year). |
| Data Point Aggregate | All totals below the graph |
The total for each Data Point displayed in the graph. NOTE: These may not be unique as the same content could be reported on multiple data points. |
Fig.4: Precalculated List
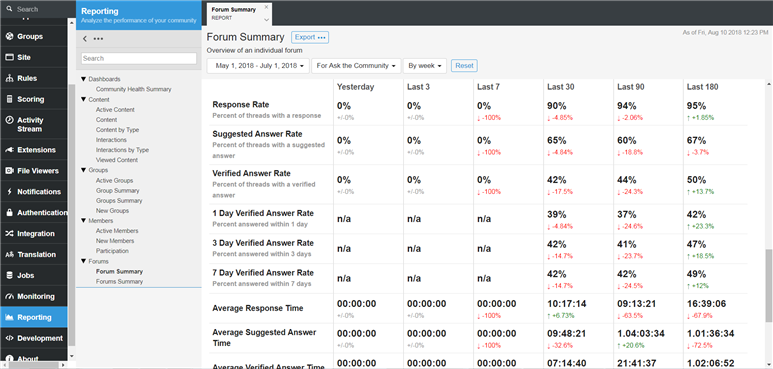
Usage
Filters: Date Range, Single Application
Report Access: Any user with the View Site Reports or View Group Reports permission can view this report. Users with View Group Reports permission are limited to viewing Groups where they have the permission.
Annotation: 1-Day, 3-Day, and 7-Day Verified Answer Rate reporting begins at the Last 30 days column. The first 3-columns are Not Applicable to this report.
Exports:
- A CSV file of the group summary. The CSV contains the following fields:
- Id
- Title
- Url
- Total Threads
- Total Replies
- New Thread Count Last(1 Day, 3 Days, 7 Days, 30 Days, 90 Days, 180 Days)
- New Reply Count Last (1 Day, 3 Days, 7 Days, 30 Days, 90 Days, 180 Days)
- New Suggested Answer Count Last (1 Day, 3 Days, 7 Days, 30 Days, 90 Days, 180 Days)
- New Answer Count Last (1 Day, 3 Days, 7 Days, 30 Days, 90 Days, 180 Days)
- Response Rate Last (1 Day, 3 Days, 7 Days, 30 Days, 90 Days, 180 Days)
- Suggested Answer Rate Last (1 Day, 3 Days, 7 Days, 30 Days, 90 Days, 180 Days)
- Answer Rate Last (1 Day, 3 Days, 7 Days, 30 Days, 90 Days, 180 Days)
- Average Response Time Last (1 Day, 3 Days, 7 Days, 30 Days, 90 Days, 180 Days)
- Average Suggested Answer Time Last (1 Day, 3 Days, 7 Days, 30 Days, 90 Days, 180 Days)
- Average Answer Time Last (1 Day, 3 Days, 7 Days, 30 Days, 90 Days, 180 Days)
- Thread Author Count Last (1 Day, 3 Days, 7 Days, 30 Days, 90 Days, 180 Days)
- Reply Author Count Last (1 Day, 3 Days, 7 Days, 30 Days, 90 Days, 180 Days)
- Suggested Answer Author Count Last (1 Day, 3 Days, 7 Days, 30 Days, 90 Days, 180 Days)
- Answer Author Count Last (1 Day, 3 Days, 7 Days, 30 Days, 90 Days, 180 Days)
- Contribution Activity Count (1 Day, 3 Days, 7 Days, 30 Days, 90 Days, 180 Days)
- Group Id
- Group Name