
The Content report provides an understanding of the volume of different types of content being created.
Community and group managers can understand individual(s), role(s), application(s), group(s), or the entire community's level of content contribution to determine which type of content is created most often. They are able to adjust visibility or increase content creation in areas that may be lagging.
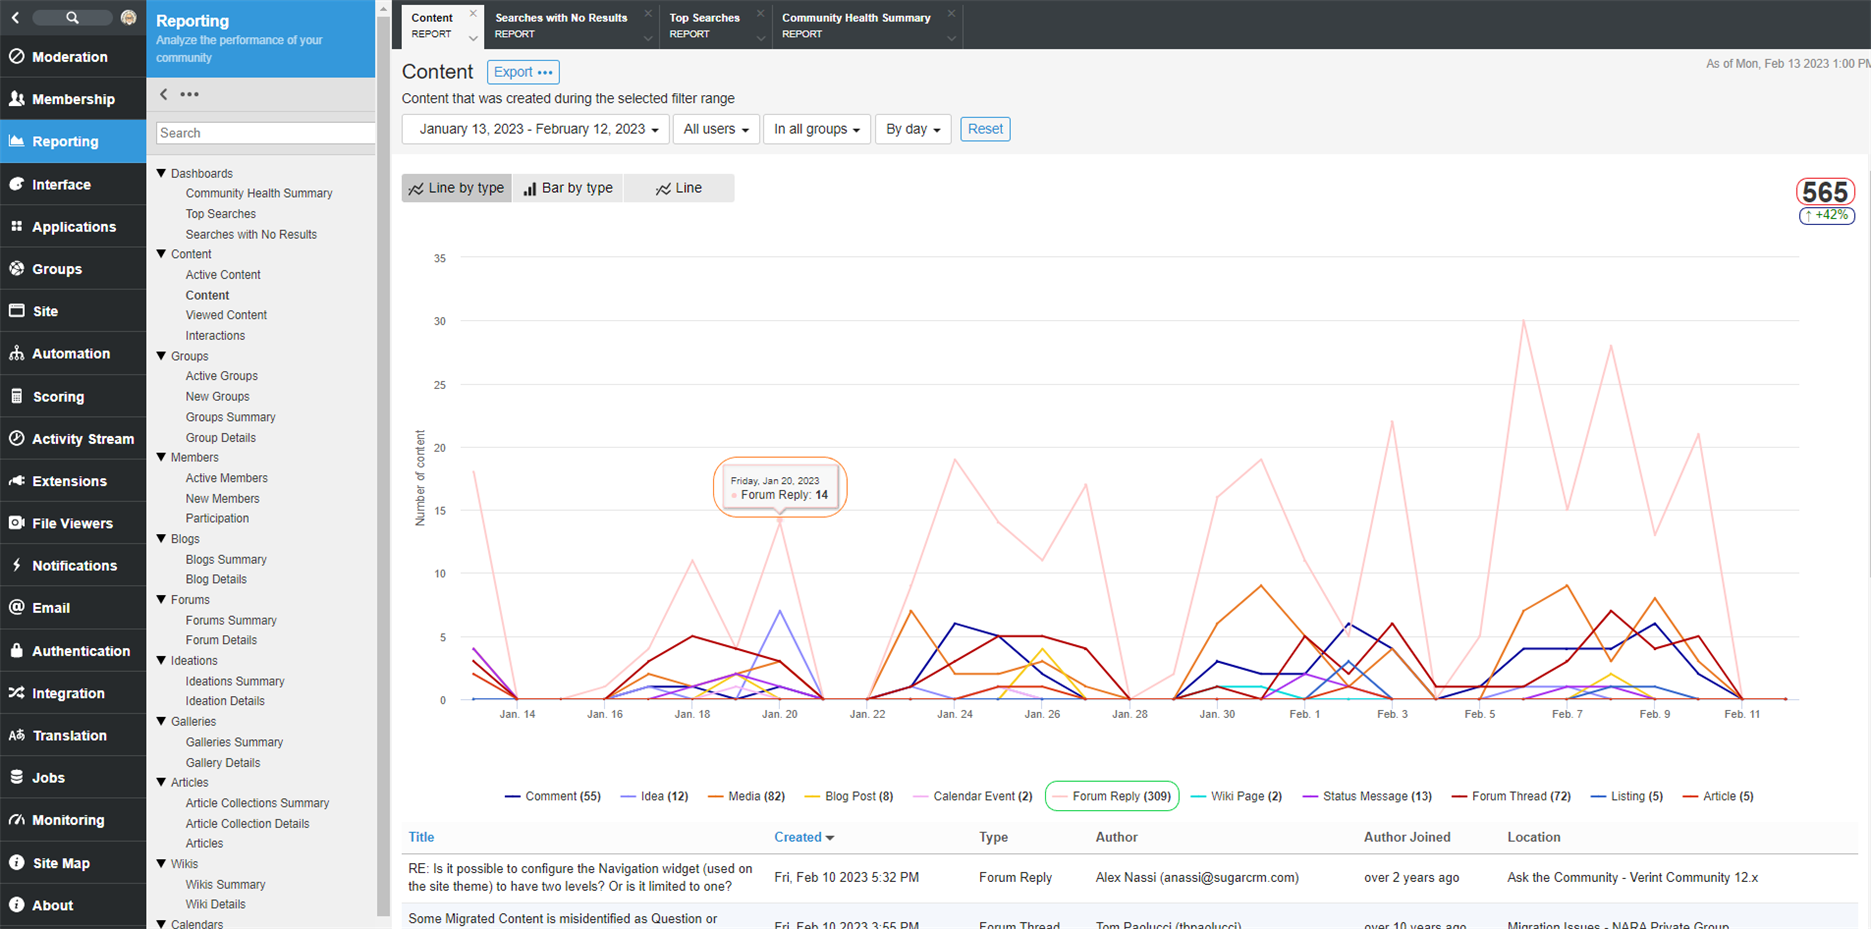
Data Points
| Data Point | Location | Description |
| Total | Red Circle |
The total number of approved content created during the dates between the specified start and end dates. Unapproved or abusive content is not included. |
| Trend | Blue Circle |
The percent of changes from the previous period specified. |
| Data Point Total | Orange Circle |
Each clickable data point shows the total number of content by type created during that data point interval (day, week, month or year). Additionally, each type of Interaction can be shown or hidden by clicking on the corresponding item in the graph's key. |
| Data Point Aggregate | Green Circle |
The totals for each Data Point displayed in the graph. |
Usage
Filters: Date Range, Users and Roles, Groups and Applications
Report Access: Any user with the View Site Reports or View Group Reports permission can view this report. Users with View Group Reports permission are limited to viewing Groups or Applications where they have the permission.
Exports:
- A PNG image of the Content by Type graph
- A CSV file of the data used to create the Content by Type graph
- A CSV file of the list of content. The CSV contains the following fields:
- Id
- Title
- Url
- Username
- Type
- Created Date
- Group Id
- Group Name
- Application Id
- Application Name