
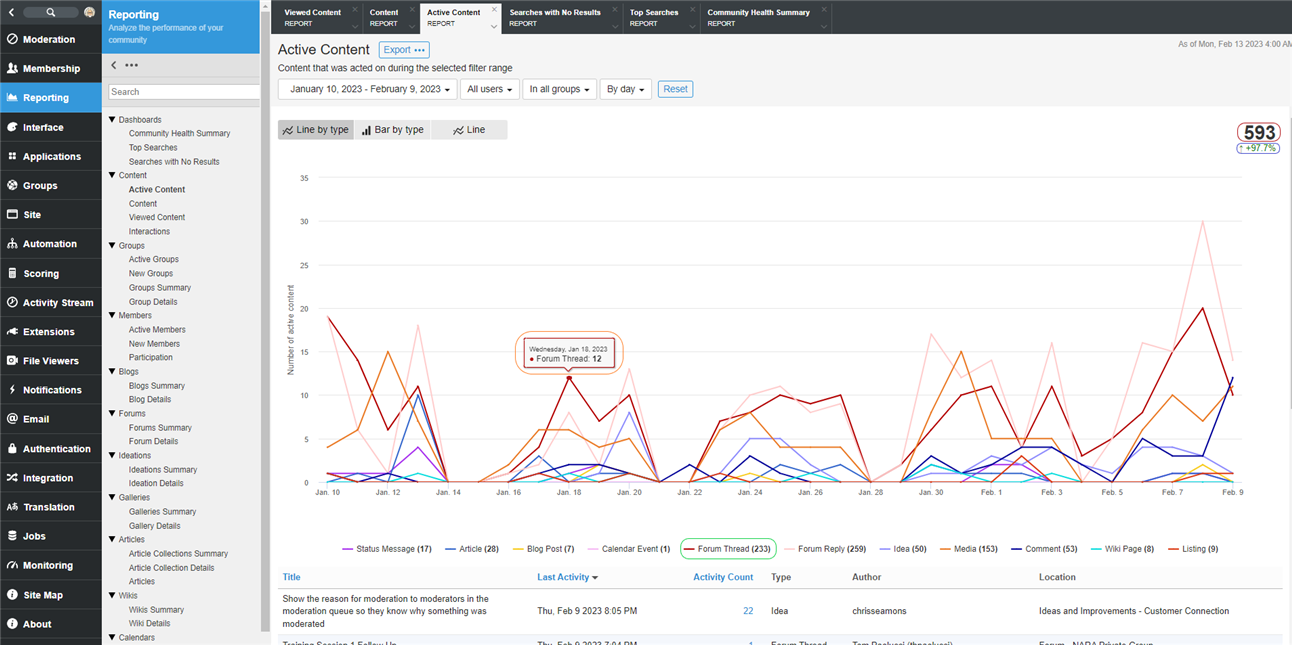
The Active Content report shows when content which had at least one active action performed on it. This can be used to understand the most active content within the community, group or application.
Data Points
| Data Point | Location | Description |
| Total | Red Circle |
The total number of unique content with at least one active action during the dates between the specified start and end dates. |
| Trend | Blue Circle |
The percent of changes from the previous period specified. |
| Data Point Total | Orange Circle |
Each clickable data point shows the total number of unique content with at least one active action during that data point interval (day, week, month or year). Additionally each type of Interaction can be shown or hidden by clicking on the corresponding item in the graph's key. |
| Data Point Aggregate | Green Circle |
The total for each Data Point displayed in the graph. NOTE: These may not be unique as the same content could be reported on multiple data points. |
Usage
Filters: Date Range, Users and Roles, Groups, and Applications
Report Access: Any user with the View Site Reports or View Group Reports permission can view this report. Users with View Group Reports permission are limited to viewing Groups or Applications where they have the permission.
Exports:
- A PNG image of the Active Content graph
- A CSV file of the data used to create the Active Content graph
- A CSV file of the list of active content. The CSV contains the following fields:
- Id
- Title
- Url
- User Id
- Username
- Type
- Last Activity Date
- Activity Count
- Group Id
- Group Name
- Application Id
- Application Name