
Report Overview
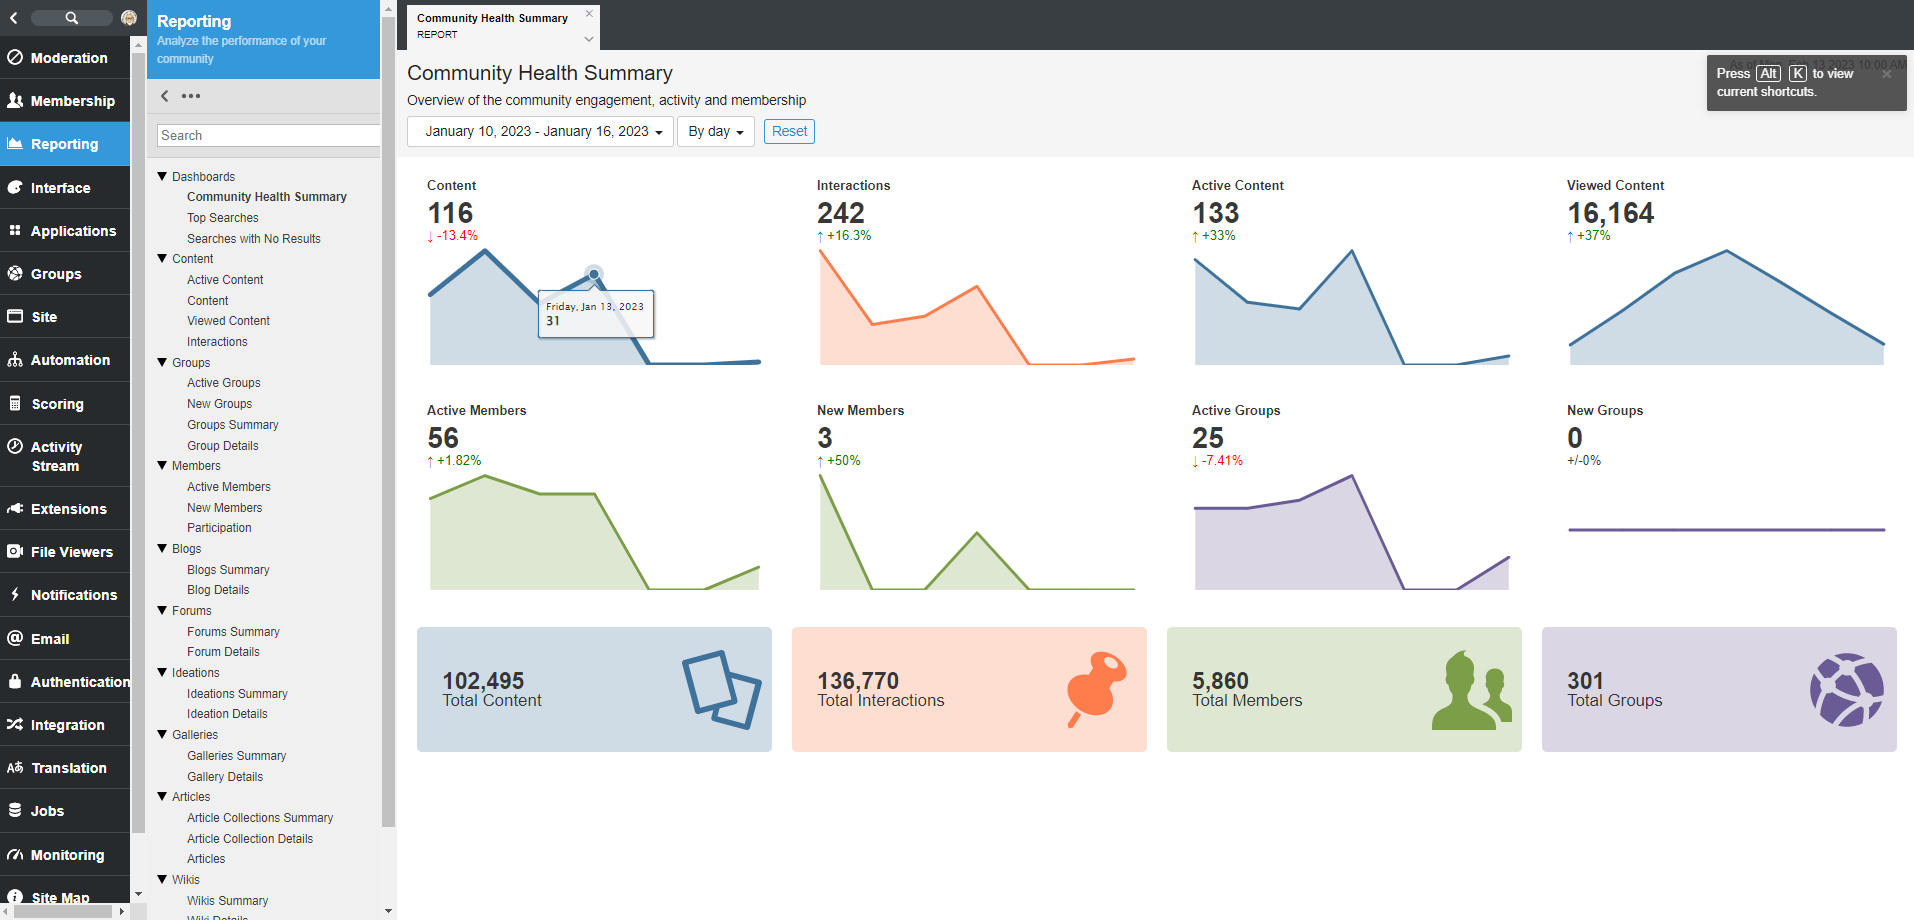
The Community Health Summary widget provides a quick view into the key performance indicators (registrations, groups, content and interactions) for the entire community to understand the size, growth, level of activity, and amount of engagement.
Typically, this information is available to the Community Manager who is responsible for reporting on how well the community is functioning and recommendations for improvements.
Report Breakdown
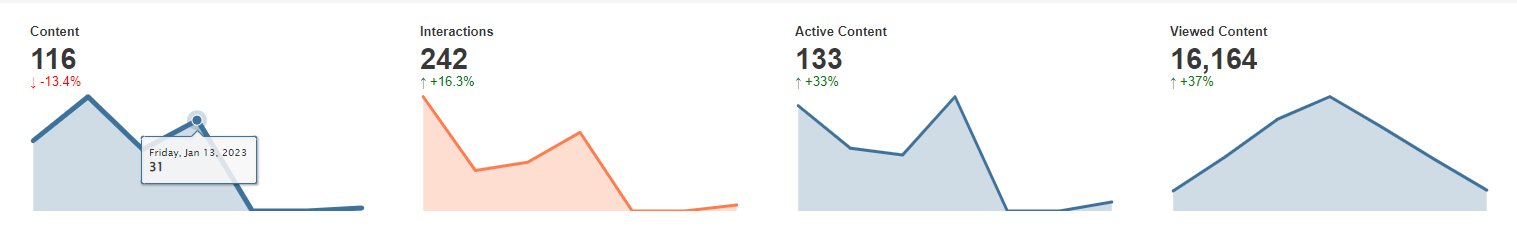
Content and Interaction Tiles
These Tiles each contain a Total (BOLD) and Trend (Downward/Upward) vs. Last Period*. A line graph for the date range selected is also presented with clickable data points to show the total count for action that data point interval; day, week, month or year (see: Friday, Jan 13, 2023 in image below). Each Tile is clickable to view its detailed report.
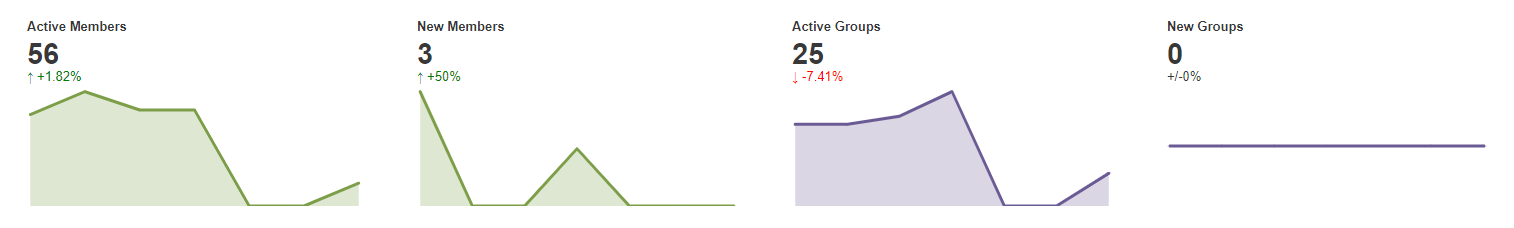
Members and Groups Tiles
These Tiles each contain a Total (BOLD) and Trend (Downward/Upward) vs. Last Period*. A line graph for the date range selected is also presented with clickable data points to show the total count for action that data point interval; day, week, month or year (see: Friday, Jan 13, 2023 in image above). Each Tile is clickable to view its detailed report.
Cards
Display all-time totals for Content, Interactions, Members and Groups. These values are not affected by the date range selected at the top of the page.

*"Last Period" represents the same length of time immediately preceding the time period defined for your report. For example, when looking at April 1-30, the last period would be the 30-days prior to April 1, March 2 - 31
Filters: Date Range
Report Access: Any user with the View Site Reports permission can view this report.
Exports: None