
The Calendar Details report shows an overview of the selected calendar.
Fig.2: Content by Type Line Graph
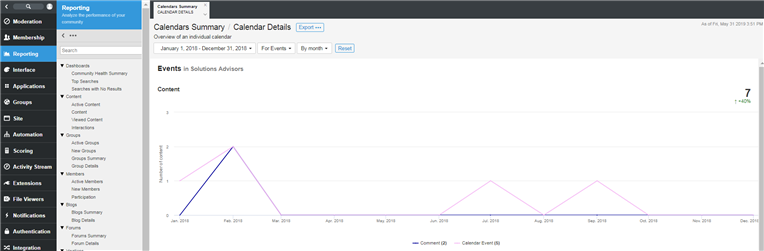
Fig.3: Interactions Line Graph
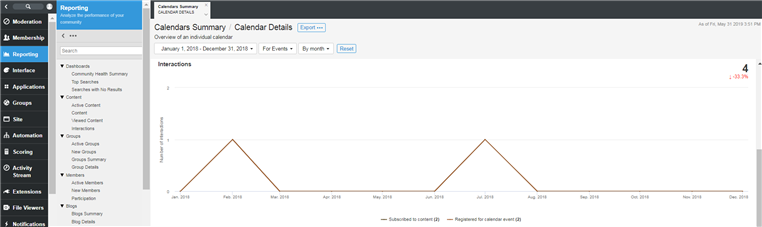
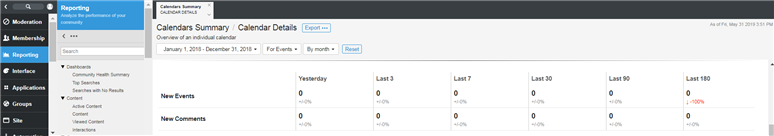
Fig.4: Precalculated List
Data Points
| Data Point | Description |
| Content - Data Points |
The graph of content created by type is available in line (see figure 2) format. Each clickable data point on the line graph shows the total number of content by type created during that data point interval (day, week, month or year). Additionally each type of content can be shown or hidden by clicking on the corresponding item in the graph's key. |
| Interactions - Data Points |
The graph of interactions by type is available in line (see figure 3) format. Each clickable data point on the line graph shows the total number of interactions by type that occurred during that data point interval (day, week, month or year). Additionally each type of interaction can be shown or hidden by clicking on the corresponding item in the graph's key. |
Usage
Filters: Date Range, Single Application
Report Access: Any user with the View Site Reports or View Group Reports permission can view this report. Users with View Group Reports permission are limited to viewing Groups where they have the permission.
Exports:
- A CSV file of the calendar details. The CSV contains the following fields:
- Id
- Title
- Url
- New Event Count Last(1 Day, 3 Days, 7 Days, 30 Days, 90 Days, 180 Days)
- New Comment Count Last (1 Day, 3 Days, 7 Days, 30 Days, 90 Days, 180 Days)
- Total Events
- Total Comments
- Group Id
- Group Name