
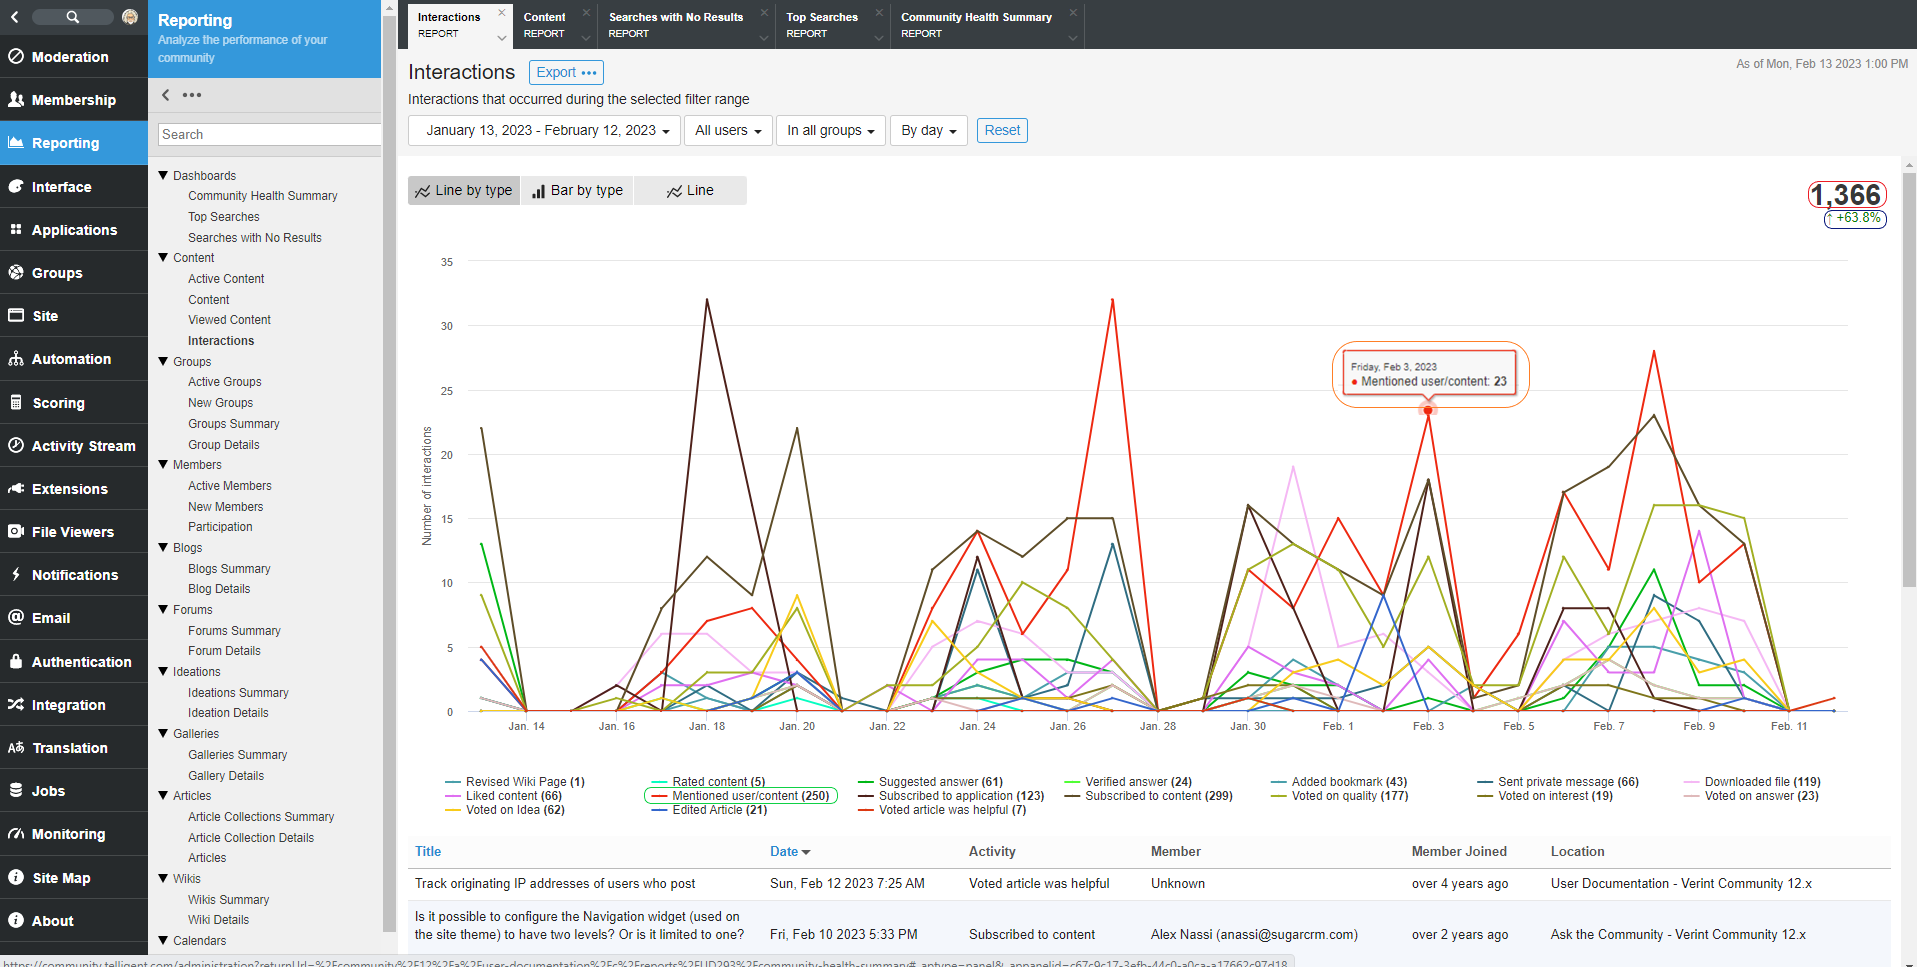
The Interactions report shows a list of actions that occurred on content (i.e. Liking or Rating) separated by type. This can be used to understand the volume and type of interactions that are occurring in your community.
Data Points
| Data Point | Location | Description |
| Total | Red Circle | The total number of interactions that occurred during the dates between the specified start and end dates. |
| Trend | Blue Circle |
The percent of changes from the previous period specified. |
| Data Point Total | Orange Circle |
Each clickable data point on the line graph, or bar section on the bar graph, shows the total number of interactions during that data point interval (day, week, month or year). Additionally each type of Interaction can be shown or hidden by clicking on the corresponding item in the graph's key. |
| Data Point Aggregate | Green Circle |
The total for each Data Point displayed in the graph. NOTE: These may not be unique as the same content could be reported on multiple data points. |
| Interaction List | Page Bottom |
The list displays each interaction that occurred, the content it occurred on and who performed it. |
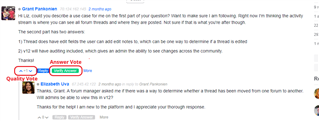
Forum Vote Details
Voted on quality = Up/Down votes which influence quality sorting. Applies to any kind of forum thread or comments.
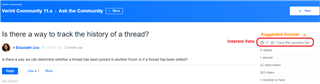
Voted on answer = Suggestion or verification of an answer which either immediately verifies or casts a vote toward it being a suggested or verified answer based on the forum's suggested and verified answer vote thresholds. Only applies to QA forum threads.
Voted on interest = "I have this question too", which allows you to answer vote on replies, receive notifications, and casts a vote for the question as being important or frequently-asked. Only applies to QA forum threads.
Usage
Filters: Date Range, Users and Roles, Groups and Applications
Report Access: Any user with the View Site Reports or View Group Reports permission can view this report. Users with View Group Reports permission are limited to viewing Groups or Applications where they have the permission.
Exports:
- A PNG image of the Interactionsgraph
- A CSV file of the data used to create the Interactions graph
- A CSV file of the list of content. The CSV contains the following fields:
- Id
- Title
- Url
- Username
- Activity Type
- Activity Date
- Group Id
- Group Name
- Application Id
- Application Name