Content view reports: chart results unclear

We want to report on monthly content views and the % of those from anonymous users, but I'm not sure I'm interpreting the data correctly as the data in the chart doesn't tally with the totals. This is the method I'm using to get figures.

To get a total for content views: reports/content /viewed content/add date range/export and sum the total view count column

To get total anonymous content views: reports/participation/add date range/filter by user ‘anonymous’

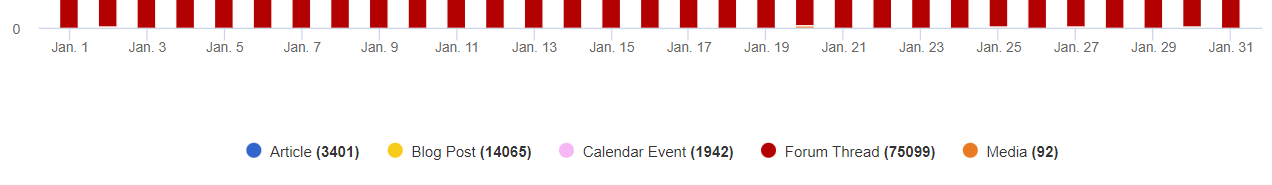
Using this method I'm getting around 295k total views for January. Is the chart showing the number of items viewed on a particular day, i.e. each content item is counted only once, regardless of how many views it had on that day? But in that case, what are the totals shown below the charts (as shown)? For January, these only add up to around 94k (which looks like the sum of the daily totals given in the bar chart).

Parents
  • Former Member
    0 Former Member

    Each content item is only counted once per period (day, week, month, year) in the chart.  The key below the chart is a summary of the chart.  For example if you have a single content item that was viewed 2 times every day for 30 days.  The chart would display 1 for every day, the key would display 30 and the listing at the bottom would show 60 total views for that content item.

Reply
  • Former Member
    0 Former Member

    Each content item is only counted once per period (day, week, month, year) in the chart.  The key below the chart is a summary of the chart.  For example if you have a single content item that was viewed 2 times every day for 30 days.  The chart would display 1 for every day, the key would display 30 and the listing at the bottom would show 60 total views for that content item.

Children